Extreme Weather Data and Visualization Hub
What is this site?
Interactive maps and explorers for extreme weather. Site development is ongoing, new updates expected regularly. Send feedback with bugs or requests.
Dashboards
Tropical Cyclones
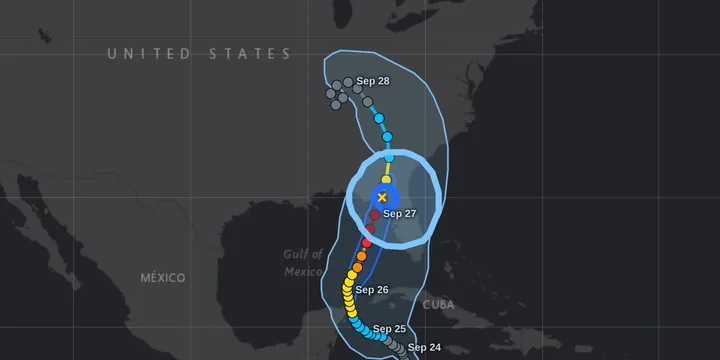
tcviewer.org: IBTrACS TC Track & Wind Footprint Map Explorerexternal site
Maps of all global tropical cyclones: individual storm, day in history, month in history, and date range
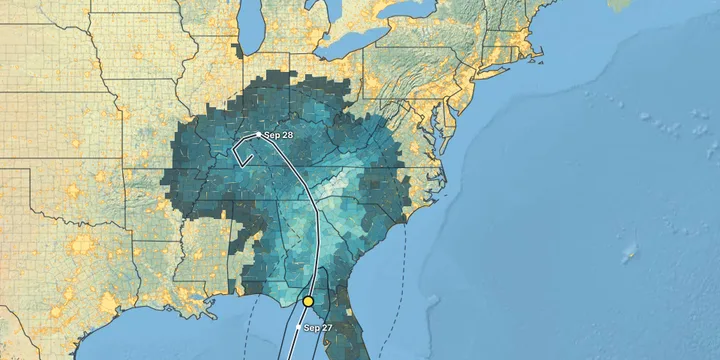
tcviewer.org: Storm Hazards & Impacts by Countynew — in betaexternal site
“What did this hurricane do, and where?” Every U.S. tropical storm and hurricane since 2004, county by county: wind, rain, storm surge, inland flooding and tornadoes, plus deaths, injuries, damage and power outages. Click any county for its details.
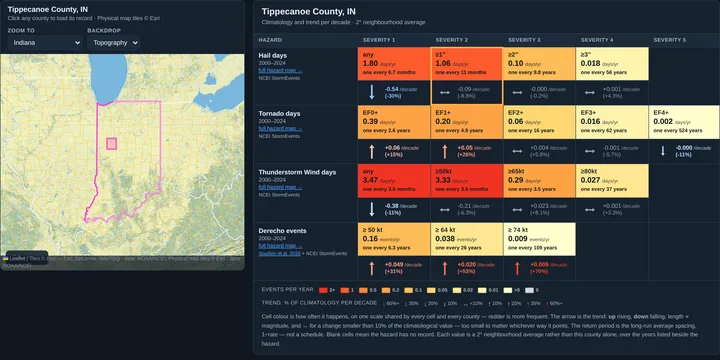
Severe Weather wind, hail, tornado, derecho, extreme heat, heavy rain, snow, freezing rain
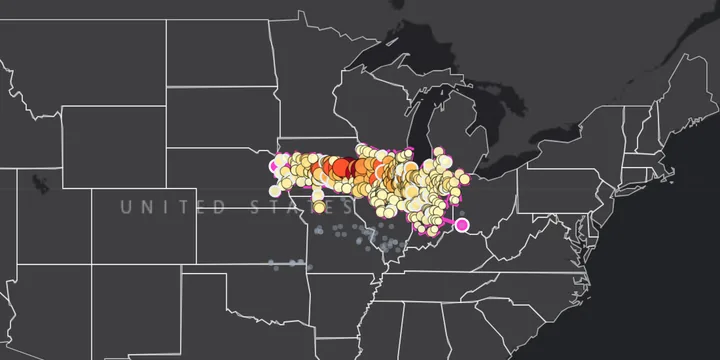
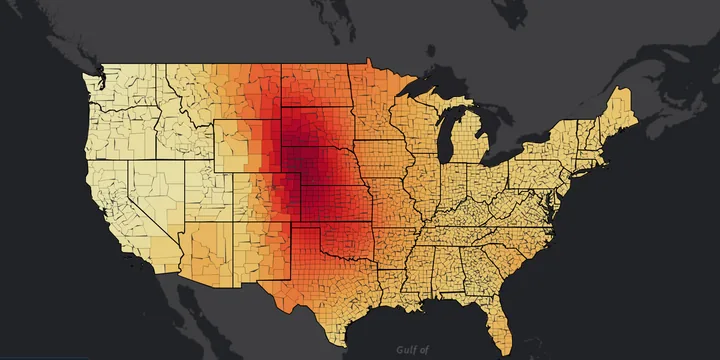
Climatology & Trends — county level
Paired climatology and trend maps at U.S. county resolution, with annual and month-by-month series. Hail, tornado, thunderstorm wind and derecho days, extreme heat and heat index (ERA5) and heavy rain (PRISM), plus station records: snowfall (GHCN-Daily), freezing rain (airport stations nationwide) and peak wind (Indiana).
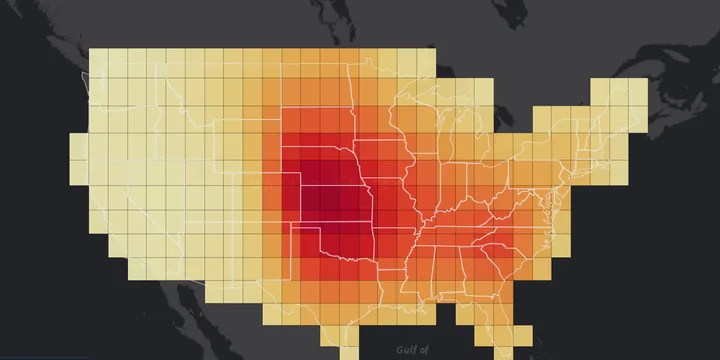
Climatology & Trends — 2° grid
Paired climatology and trend maps of hail, tornado, thunderstorm wind and derecho days, extreme heat and heat index, and heavy rain, binned into a regular 2° grid.
Climate The average year, and El Niño & La Niña
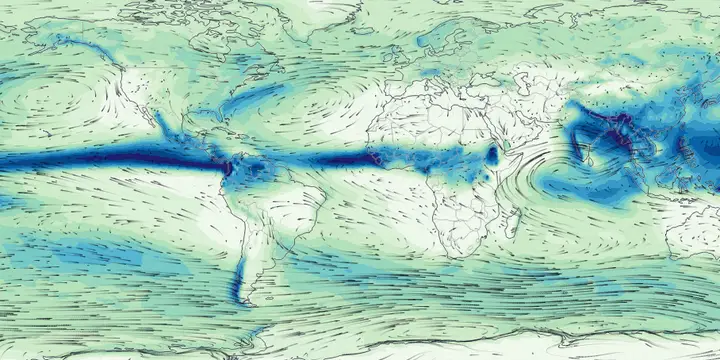
EarthVis: Climate and Extremes Through the Yearnew — in beta
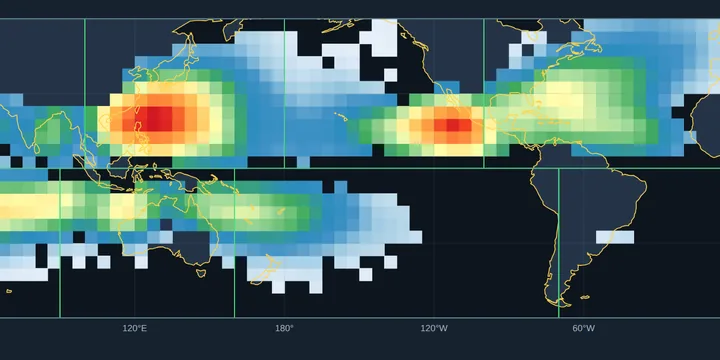
Animated maps of the average year, 1996–2025, for 30 ERA5 fields: temperature, precipitation, clouds, radiation, winds and pressure, and severe-storm ingredients. Also included are global tropical cyclone activity, U.S. hail, tornado, wind and derecho days, and an incomplete worldwide tornado map. Choose month by month, a season, the annual mean, the size of the seasonal cycle or the month of the peak, on a world map, a globe you can spin or a regional view, with wind arrows on top. Click anywhere for its seasonal cycle, and export any map or animation as a PNG, MP4 or GIF for teaching.
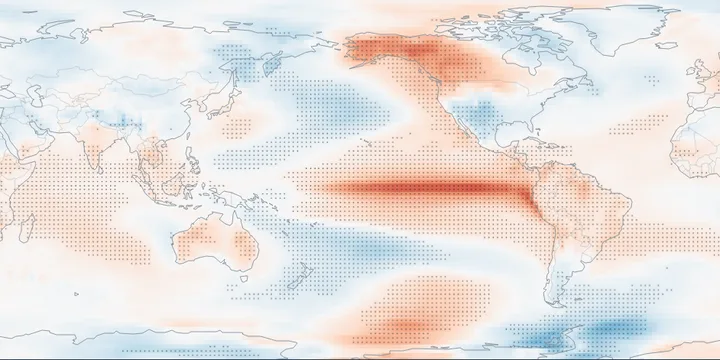
El Niño & La Niña Impacts — global gridnew — in beta
How a typical year, season or month differs in El Niño or La Niña years (an ENSO year runs June–May), beside its climatology: ERA5 temperature, precipitation and snowfall worldwide, global tropical cyclone activity, and U.S. hail, tornado and wind days and derecho events. The years used come from NOAA’s Relative Oceanic Niño Index, shown with every event marked.